Recreation Programs - Total Cumulative Participation
Desired Result: Above Target

Analysis of Performance
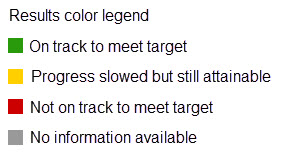
We are on track and meeting target for this measure.
Metric Definition
The total number of participants in Recreation programs, events and facility visits.
Why Is This Important?
This metric provides an indication of the diversity and popularity of our Recreation programs. Offering a wide range of popular programs is a hallmark of successful operation.
City Organization Impact on Performance
High – Recreation influences participation by offering a variety of diverse programs that appeal to the community while reflecting the community's demographics. Recreation also influences participation numbers through marketing and community outreach. Recreation directly influences the amount of programs by determining the recreational needs of the community and developing programs that appeal to the community.
Benchmark Information
Benchmarking in progress