Gardens on Spring Creek - Total Cumulative Participation
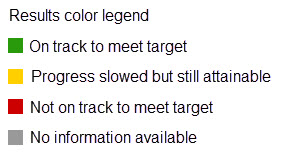
Desired Result: Above Target

Analysis of Performance
In Q1 2025, The Gardens hosted 5,705 total guests (admissions, classes, events, etc.). This is only 1% lower than Q1 2024. January and February saw concerning declines, but March made up some difference. In Q1, 750 guests experienced The Gardens through the Gardens for All access program.
Metric Definition
The total number of participants at the Gardens on Spring Creek.
Why Is This Important?
This metric provides an indication of the popularity of these facilities which, in turn, indicates how well the facilities are meeting the needs of the community.
City Organization Impact on Performance
High – Cultural Services directly influences this metric by developing and offering a diverse and wide-ranging variety of programs that appeal to the community. Participation numbers are also influenced through marketing and outreach. Cultural Services also directly influences the amount of programs offered at the Gardens on Spring Creek by creating programs that interest the community on a variety of levels.
Benchmark Information
Benchmarking in progress