
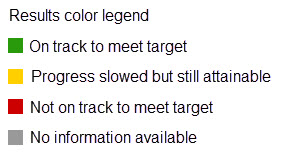
Analysis of Performance
Note: Review and validation of this data is conducted by the CO Department of Public Health and Environment (CDPHE) and can take 8 - 12 weeks after the quarter ends. Accordingly, current performance is based on the prior quarter's results.
In Q2 of 2025, four days measured at “Unhealthy for Sensitive Groups” (USG) levels due to elevated ground-level ozone concentrations. This is consistent with typical seasonal trends observed along Colorado’s northern Front Range, where warmer temperatures, increased sunlight, and precursor emissions combine to produce higher ozone levels during late spring and summer months.
- Ozone and particulate matter are regional issues with health implications.
- Local initiatives to improve air quality include efforts to reduce emissions from oil and gas operations and gas vehicles and incentive programs to replace gas powered lawn and garden equipment with electric options.
- Education and outreach resources are also provided to increase awareness about the health impacts of high pollution days, including a data monitoring website (see fcgov.com/airquality).
Metric Definition
The Air Quality Index (AQI) is used by the EPA to communicate daily air pollution and health implications. Shown are the number of days per quarter in which the ozone or PM2.5 AQI was categorized as “Unhealthy for Sensitive Groups”, “Unhealthy” or “Very Unhealthy”. The metric is a measure of the number of 'good' air quality days (as defined by EPA's Air Quality Index - AQI) in a quarter based on air quality monitoring data from Fort Collins. The AQI is calculated by EPA as a measure of local air quality and its effect on human health. The higher the AQI value, the greater the level of air pollution and the greater the health concern. 'Good' air quality corresponds to an AQI of 50 or less (on a scale of 0-500) and poses little or no risk of adverse health effects.
Why Is This Important?
The Air Quality Index (AQI) is used by the EPA to communicate daily air pollution and health implications. Shown are the number of days per quarter in which the ozone or PM2.5 AQI was categorized as “Unhealthy for Sensitive Groups”, “Unhealthy” or “Very Unhealthy”.
City Organization Impact on Performance
Low – This metric is influenced much more directly by atmospheric conditions and emissions from motor vehicles and industry than it is by City efforts to implement emission reduction strategies and programs.
Benchmark Information
THE AQI for ozone and particulate matter have not been benchmarked against other world class cities because the measures are highly influenced by local and regional factors that are not comparable to other cities. Ozone concentrations are influenced by meteorological and topographical conditions that can be unique to each city. In addition, ozone is influenced by transport from other regions. Particulate matter concentrations are influenced by local climate conditions and local emission sources that can be unique to each city and can be highly influenced by natural events such as wildfire.